
Metrics, logs and traces
In the tool you use or pick, with apps instrumented through OpenTelemetry, an open standard, so you can change tools later without rewriting code.
Our cloud infrastructure monitoring services set up and run monitoring on the tools you use or pick: Amazon CloudWatch, Azure Monitor, Google Cloud Monitoring, Datadog, or Prometheus and Grafana. Engineers sit behind every alert, with 24x7 response to critical incidents and the rest handled in business hours, plus the patching, capacity and backup work that prevents the next one.
 4.8
 Written by Abhishek Kumar, Content Writer












Cloud infrastructure monitoring is the continuous collection of metrics, logs and traces from servers, containers, databases and cloud services, with alerts when something breaks or is about to. Managed cloud monitoring adds the people: incident response, patching and backup checks.
Instrumentation comes first, because you cannot fix what you cannot see.
Get a free proposalIn the tool you use or pick, with apps instrumented through OpenTelemetry, an open standard, so you can change tools later without rewriting code.
Alerts start from the four golden signals in Google's SRE book: latency, traffic, errors and saturation. Each has a severity, an owner and a runbook, and reaches an engineer through PagerDuty or your on-call tool.
An engineer works the runbook and updates you in Slack, Teams or a status page. Serious incidents end with a blameless review and fixes that stop a repeat.
Scheduled patching with AWS Systems Manager Patch Manager, Azure Update Manager or Google Cloud VM Manager, test servers first. Security findings go to our cloud security and compliance team.
We forecast growth, tune autoscaling before peaks and flag idle resources. Deeper work goes to our cloud performance optimization and cloud cost optimization teams.
Synthetic checks test key pages, APIs and logins, and service level objectives set measurable targets. A monthly report covers incidents, patches and next risks.
Good monitoring is quiet most of the time. This is what teams notice.
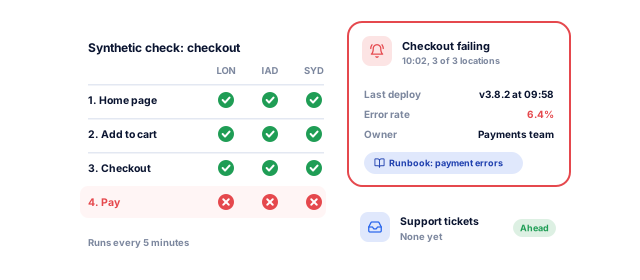
Synthetic checks and error-rate alerts catch a failing checkout or an expired certificate early, so you hear about it from an alert, not a customer.
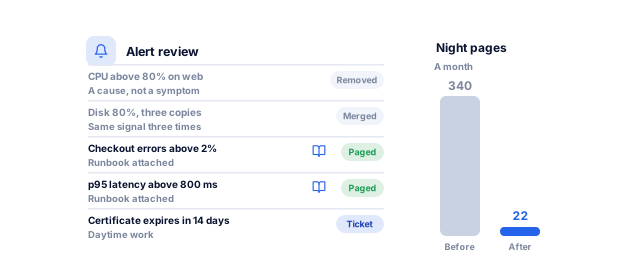
Google's SRE guidance says every page should be actionable. We remove duplicates, alert on symptoms users feel rather than high CPU and attach a runbook to each alert.
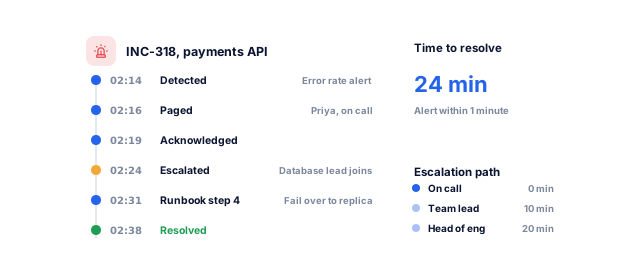
In the Uptime Institute Annual Outage Analysis 2026, 57% of respondents said their latest major outage cost over $100,000, and 1 in 5 put it above $1 million. Fast detection shortens every incident.
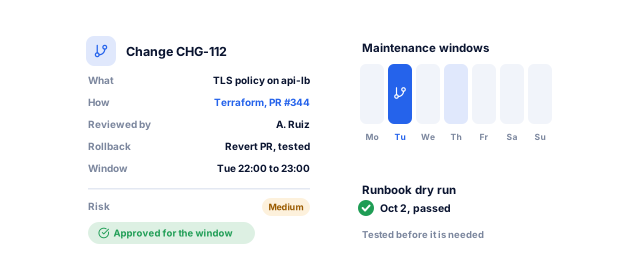
The same analysis found that failing to follow procedures remains the leading driver of human-error outages. Changes go through code review, and risky work happens in agreed windows.
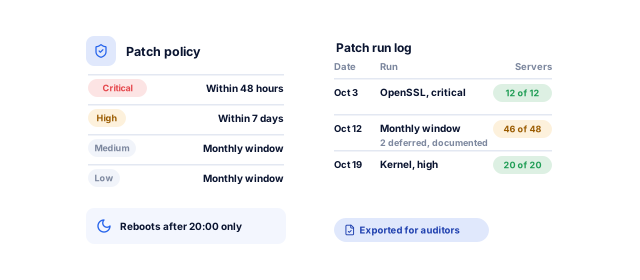
Software vulnerabilities were the starting point for 31% of breaches in the Verizon 2026 Data Breach Investigations Report. We patch by severity, critical fixes first, and log each run for auditors.
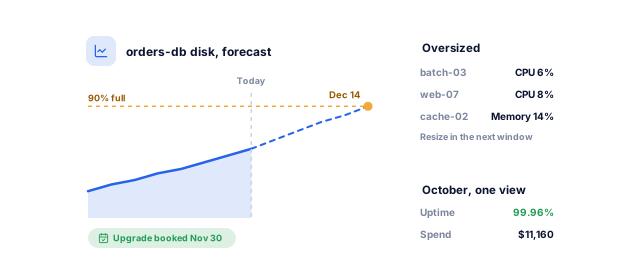
Growth forecasts show weeks ahead when a disk or database will run out of room, and what is oversized, so upgrades and budgets are planned.
Give us read-only access to your cloud and monitoring accounts. We will send a free review of coverage gaps, noisy alerts and missing runbooks, ranked by risk.
We map services and current tools, read recent incidents and agree what down and slow mean.
A shared picture of what mattersAgents and OpenTelemetry go in, and each service gets a dashboard and synthetic checks.
Full visibilityEvery alert gets a severity, routing, escalation contacts and a runbook that says what to check first.
Clear rules for every alertWe fix what keeps breaking: recurring alerts, filling disks, the patch backlog, silent backup failures.
A calmer baselineWe respond to incidents, patch in agreed windows and check backups. Every action is logged.
Systems that stay healthyMonthly reports on availability, incidents and risks, and a quarterly review of capacity, cost and objectives.
Fewer incidents over timeWhat to watch depends on what each system does for your business.
Application performance monitoring traces a slow endpoint to its query, and clusters are watched in Prometheus and Grafana with our Kubernetes team.
Synthetic tests walk through search, cart and payment every few minutes, we load-test before sales, and our ecommerce website development team fixes the storefront issues monitoring finds.
We monitor patient portals and records systems, keep audit logs for the period your regulations require, and patch outside clinic hours. We also build hospital management systems for healthcare businesses.
ERP, CRM and finance failures are often silent until data goes missing, so we monitor scheduled jobs, integrations and queues as well as servers. See our ERP software development work.
When workloads span several clouds and on-premises servers, we bring telemetry into one place, usually Datadog or Grafana, so one engineer can follow an incident end to end. See multi-cloud management.
A monitoring tool shows you problems; somebody still has to fix them.
Book a strategy call| Factor | In-house team | Monitoring tool only | Managed service with improveFX |
|---|---|---|---|
| Who watches alerts | Your engineers, alongside project work | Your engineers; the tool only sends alerts | Our engineers: critical incidents 24x7, the rest in business hours |
| Who fixes incidents | Your team | Your team | We do, escalating code changes to your developers |
| Patching and capacity work | Often postponed when projects are busy | Not included | Scheduled monthly and reported |
| Out-of-hours coverage | Needs a rota of several people | Alerts only, nobody responds | An engineer on critical incidents 24x7 |
| Cost structure | Salaries, training and tools | Tool license, usually priced by hosts or data volume | Monthly fee plus tooling, no hiring |
| Best when | You have a dedicated operations or SRE team | You have engineers with time to respond | You want operations covered without hiring |
Many clients combine approaches: your team owns the application while we run the infrastructure. Tool licenses are separate from our fee.
Onboarding takes about 2 to 4 weeks; alert tuning continues through the first 2 months.
Book a strategy callBy week 2, you can see every service on one set of dashboards.
By week 4, alerts reach our engineers, with 24x7 response to critical incidents.
By week 8, alerts are fewer, and each one needs a person.
You approve each step before we change anything, and everything we set up stays in your accounts.
Yours to keep, always. Everything is set up in your name, and if you leave we remove our access and hand over the documentation.
Teams that want their alerts answered, not just more dashboards.
Book a strategy callMany alerts lead back to code: a slow query, a memory leak, a retry loop. Our developers fix the cause, and database issues go to our cloud database management specialists.
Critical incidents get an engineer 24x7, other issues are handled in business hours, and the monthly report lists each incident and what we changed.
Accounts stay in your name, and we work through roles you can remove, after an NDA. Runbooks and infrastructure code sit in your repository, ready for another team.
These numbers come from our SEO, marketing and software work, measured in each client’s own analytics. Your cloud numbers start with the free review.
See all case studies
MastersBuddyStudy abroad consulting
160+
keywords in Google's top 10
AkosMDHealthcare, Arizona
+57%
patient footfall
Eric OriginalsJewelry ecommerce
+1,900%
organic traffic
"From designing a high-converting website to managing our SEO, Google Ads, and Google Business Profile, improveFX delivered exceptional results across every channel."
 Maureen CappalloBroker and founder, Momentus Real Estate Group
"They revolutionized our online presence with a 60% increase in web traffic through strategic e-commerce SEO and content optimization."
 Eric NoahPresident, Eric Originals & Antiques Ltd.
"Visionstar Technologies' online presence transformed significantly with a 40% boost in customer engagement, all thanks to their exceptional website structuring and SEO tactics."
"Their strategic approach to our website and SEO resulted in a 60% increase in local inquiries, revolutionizing our automobile service business."
"Their SEO strategy helped us achieve top search rankings, while their Facebook Ads campaigns drove a steady flow of qualified prospects."
 Amita NaithaniCo-founder, Amita Naithani Resort Wear
Not seeing yours? Ask us directly and a specialist will reply personally.
Cloud infrastructure monitoring services include metrics, logs and traces, dashboards, alerting with on-call routing, uptime checks and incident response, on the tools you already use or pick.
With improveFX they also cover runbooks for each alert, patching, backup and certificate checks, capacity forecasts, post-incident reviews and a monthly report. Code fixes and larger projects, such as performance tuning, are scoped separately.
Monitoring tells you what is happening and alerts you when something is wrong. Cloud infrastructure management is the work done in response: fixing incidents, patching, scaling and preventing repeats.
A monitoring tool alone leaves that work with your team. Managed cloud monitoring from improveFX combines both: the tool, the engineers who answer its alerts, and someone accountable for the follow-up.
Ongoing cloud management with improveFX runs from under $1,000 to $15,000+ a month, depending on your environment. Tool licenses, monitoring data charges and your cloud bill from AWS, Microsoft or Google are separate from our fee.
Servers, clusters, accounts and clouds set most of the fee: a few internal systems sit at the low end, customer-facing platforms across several environments with compliance reporting at the high end.
Yes. Monitoring and automated alerts run around the clock, and an engineer responds to critical incidents 24x7. Other issues are handled in business hours.
Alerts reach the engineer through PagerDuty or your on-call tool, the runbook guides the first steps, and you hear from us in Slack, Teams or email. The monthly report lists each incident and what we changed.
The ones you use or pick. Amazon CloudWatch, Azure Monitor and Google Cloud Monitoring need no extra license; Datadog or New Relic give one paid view across platforms; Prometheus and Grafana suit Kubernetes and open-source teams.
If you already pay for a tool, we work inside it. Applications are instrumented with OpenTelemetry where possible, so your data is not tied to one vendor.
Yes. Operating systems, runtimes and middleware are patched on a schedule, with critical security fixes applied first and tested on non-production servers.
Patches run in agreed maintenance windows, can be rolled back, and each run is logged as evidence for SOC 2, ISO 27001, PCI DSS or HIPAA audits. Application dependency updates are coordinated with your developers or ours, because they often need code changes.
Yes. Many clients keep their developers in charge of the application while we run the infrastructure, or use us only for out-of-hours response to critical incidents.
We agree who owns which alerts, share one incident channel and document every handover. If you are moving from another provider, we review their setup and runbooks before taking over, so nothing is dropped in the switch.
Yes, along with Kubernetes and hybrid setups that include on-premises servers, with alert rules, tags and runbooks kept consistent across them. Logs stay in the regions you choose, which matters under GDPR, UK GDPR and India's DPDP Act.
Platform management is covered by our AWS cloud management, Azure cloud management and Google Cloud management services, which this monitoring service plugs into.
Tell us what worries you about your cloud, or book a strategy call with our team.


 A specialist replies personally 4.9 from 566 client reviews