Custom dashboard development for numbers your whole team trusts
Our custom dashboard development service turns data scattered across your CRM, ERP, accounting software, online store and ad platforms into dashboards people use to make decisions. We define each metric once, build the pipelines that keep it current, and design role-based views for leadership, managers and frontline teams in Power BI, Data Studio, Tableau or a custom web app.
Custom dashboard development is the design and build of dashboards around your own metrics, data sources and users. It covers connecting systems such as your CRM, ERP, store and ad platforms, cleaning and modeling the data, and building role-based views in a BI tool or a custom web app.
Agree each metric's definition in writing before designing charts.
Refresh data as often as decisions are made; real time costs more and is rarely needed everywhere.
Internal reporting usually fits a BI tool; products, portals and live operations need custom. We build both.
Reconcile every number with its source system before launch.
Best for
Businesses with data across several systems, or teams needing customer-facing, live or role-based dashboards
What you get
Metric dictionary, data pipelines, a data model or warehouse, dashboards by role, alerts, documentation and training
Typical timeline
A first dashboard on accessible data in about 4 to 8 weeks. Multi-source platforms with a warehouse usually take 2 to 4 months.
Pricing
Our software projects run from under $5,000 to $100,000+, depending on scope. For dashboards, scope means sources, data cleanup, audiences and refresh speed. Tool licenses are separate: Power BI Pro lists at $14 per user a month, paid yearly, and Data Studio is free. We quote after a free data review.
What our custom dashboard development includes
Charts come last: most analytics dashboard development effort goes into agreeing what each number means and getting clean data to it.
Before any design, we agree what each KPI dashboard figure means: what counts as revenue or a qualified lead, which date it uses, and who owns it. A metric dictionary sits behind every chart, so finance and sales stop arguing about whose figure is right.
Data integration and pipelines
We connect CRMs such as HubSpot and Salesforce, NetSuite, QuickBooks or Xero, Shopify, GA4, ad platforms, databases and spreadsheets, through managed connectors such as Fivetran or Airbyte or custom API integrations, with alerts when a load fails.
Data warehouse and modeling
With more than a couple of sources, data lands in a warehouse such as BigQuery, Snowflake or PostgreSQL. We model it with dbt or SQL, test every load for duplicates and broken joins, and load incrementally to keep costs down. Our cloud database management team keeps it fast and backed up.
Power BI, Data Studio and Tableau dashboards
Where a BI tool fits, we build models, measures and reports in Power BI, Data Studio (Google's new name for Looker Studio) or Tableau, within each tool's limits: Power BI Pro allows eight scheduled refreshes a day and Premium 48, according to Microsoft. Often we start by fixing a report you already have.
Custom web dashboards and real-time views
When dashboards live inside your product or portal, or need data that updates in seconds, we build web apps with React, D3.js or Apache ECharts and Node.js or Python APIs, with WebSockets for live views and no per-user license fees.
Access control, alerts and scheduled reports
Access control decides who can open each dashboard; row-level security decides which rows they see, so a regional manager sees only their region in the CEO's report. Sign-in uses single sign-on, alerts reach email, Slack or Teams, and our report and analytics automation service sends scheduled PDFs from the same data.
What good dashboard development services change
A dashboard is worth building when it changes a decision or removes recurring work.
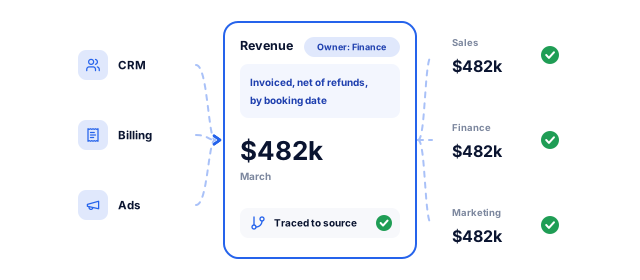
When sales, finance and marketing each pull revenue from a different system, meetings turn into reconciliation. A shared metric dictionary and one data model end that. In Salesforce's 2025 survey of 552 US business leaders, confidence in data accuracy was down 27% from 2023. Trust returns when every figure traces to its source.
Reporting hours given back
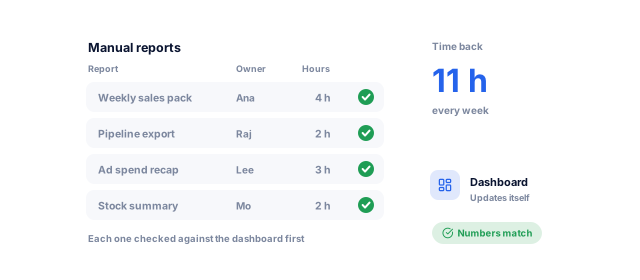
Many teams still paste exports into spreadsheets every week to rebuild the same report. Pipelines remove that work and its copy errors. We list each manual report, who builds it and the hours it takes, and retire it once the dashboard version matches.
Problems seen while they can still be fixed
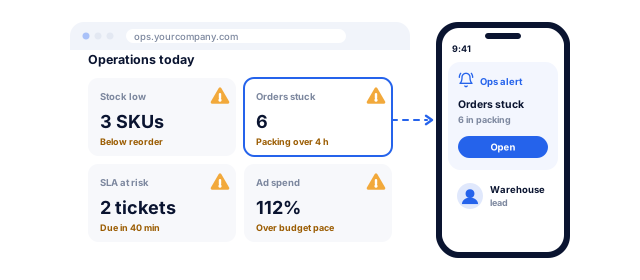
An operational dashboard shows low stock, stuck orders, tickets near their SLA or overspending ad budgets while there is still time to act. Alerts push each exception to the person who owns it, so nobody watches a screen all day.
The right view for each person
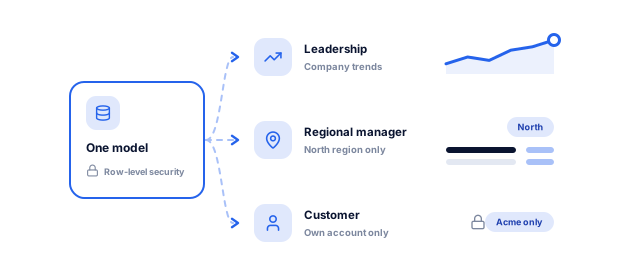
Leadership needs headline trends, a regional manager needs their region in detail, and a customer needs only their own account. Role-based views and row-level security serve each from one model, with no drifting spreadsheets and no data shown to the wrong person.
Data inside the tools people already use
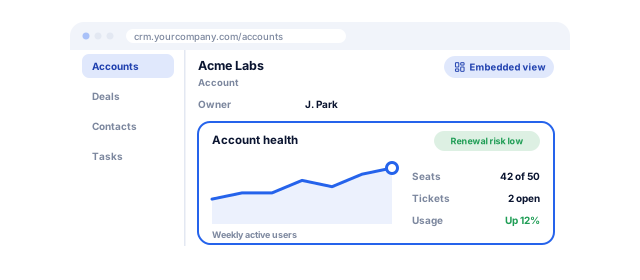
The same Salesforce survey found 90% of leaders say direct access to data within their most-used apps would help them perform better. Dashboards embedded in your CRM, intranet or product get used daily. Our custom CRM development team places views where sales already works.
A foundation for forecasting
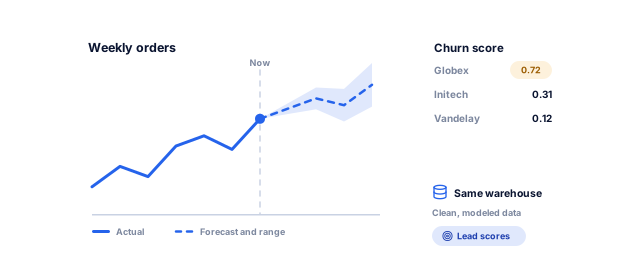
Once data is clean and modeled, the same warehouse can feed demand forecasts, churn scores and lead scoring. Our predictive analytics team builds those models when you are ready, with results in the dashboards your team already uses.
Already paying for Power BI and still exporting to Excel?
Send us the reports your teams rebuild from exports. We review your sources and decisions, then send a written plan, price range and timeline for the dashboards that replace them, built in your Power BI account or as a custom web app.
Your free software planFor what you need
1What we would build firstYour users, workflows and the systems it connects to
2A price range and timelineFor the budget you pick, with a phased option
3Build, buy or configureAnd how your team runs it after launch
We map the decisions each audience makes and how often, then pick the few metrics that inform them, each with a definition, owner, target and refresh cadence.
Decision and audience map
Metric dictionary
Refresh and access requirements
Agreement on what to measure
Data audit and access
We list every source, request read-only access, and profile sample data for gaps, duplicates and mismatched IDs. Each problem gets a fix and an owner before we build on it.
Source inventory
Data quality report
Access and security plan
No surprises in the data
Pipelines and data model
We build monitored pipelines into the warehouse or BI model and shape the data around your metrics. Tests run on every load, so failures reach our team before a wrong number reaches yours.
Monitored pipelines
Data model and tests
Documented transformations
Clean, current data in one place
Design and prototype
Each screen leads with the figure its users check first, with targets beside every number. A prototype on real data is reviewed by the people who will use it.
Wireframes by role
Prototype with real data
Design review notes
Screens people understand at a glance
Build and reconcile
We build the dashboards, set access roles and row-level security, test speed, and reconcile totals against source systems for several periods before launch.
Production dashboards
Reconciliation report
Security and performance tests
Numbers you can defend
Launch, adoption and support
We train each group, retire the manual reports the dashboard replaces, and track usage. Monthly reviews cover data issues and new requests.
Training and guides
Usage tracking
Monthly review and changes
Dashboards used every week
Dashboards for every team and business type
The method stays the same; sources, metrics and refresh needs change with the audience.
01 / 05
Executive and finance dashboards
An executive dashboard shows revenue, margin, cash, pipeline and headcount against targets and last year, from accounting or ERP software, the CRM and payroll. Finance gets drill-down; leadership gets one screen.
GA4, Google Ads, Meta Ads, LinkedIn, email tools and the CRM each count conversions their own way. We join them to show cost per lead, pipeline and revenue by channel, judged on CRM outcomes, the way our PPC management team reports to its own clients.
For online stores, we combine Shopify or WooCommerce orders, ad spend, returns, stock and margin by product, and flag best sellers about to run out or ads still spending on out-of-stock items. Stock data can come from an inventory management system we build or yours. See our ecommerce work.
Operational dashboard views track appointments and no-shows, bed occupancy, turnaround times, tickets or deliveries, and highlight exceptions rather than averages. In healthcare, patient-identifiable data stays out of management views unless a role requires it. We connect to a hospital management system or clinic software. See our healthcare work.
When customers need their own usage, orders or results, the dashboard becomes part of your product. Power BI's embed for your customers option needs paid capacity in production but no per-viewer license, according to Microsoft. A custom build inside your SaaS application gives full control over design and tenant separation.
Free for personal use; Pro $14 and Premium Per User $24 per user a month, paid yearly
No cost; a paid Pro tier adds team workspaces and admin controls
Licenses per user, as Creator, Explorer or Viewer
No per-user fees; you pay for the build and hosting
Data refresh
Up to 8 scheduled refreshes a day on Pro, 48 on Premium or Fabric capacity
Set per connector: Google Analytics and BigQuery default to every 12 hours, Sheets to 15 minutes
Live connections or scheduled extracts
Anything from nightly loads to updates within seconds
Strongest data fit
Microsoft 365, Excel, SQL Server and Azure
Google Analytics, Google Ads, BigQuery and Sheets
Large databases and warehouses
Any database or API, including your own product
Access control
Row-level security roles, applied to users with Viewer access
Sharing settings and viewer filters; strict rules belong in the data source
User filters and permissions by site role
Any rule your login system can express
Best for
Internal BI in Microsoft-based organizations
Marketing reporting on Google data at low cost
Analyst teams exploring large datasets
Customer-facing, live or high-volume dashboards
Sources: Microsoft Power BI pricing page and Microsoft Learn (refresh limits, row-level security), Google Cloud documentation for Data Studio (pricing and data freshness), Tableau Help (site roles). Google renamed Looker Studio to Data Studio. Prices exclude taxes and change over time.
Your dashboard project, week by week
A first dashboard on accessible data takes about 4 to 8 weeks; multi-source platforms follow the same phases over 2 to 4 months.
Every dashboard starts from the decisions it should support. A metric that would not change an action stays off the screen. When a better model in your existing Power BI or Data Studio account does the job, we build that and add custom views only where the tool falls short.
02
Marketing and engineering data in one team
We run Google Ads and Meta campaigns as a Google Premier Partner and Meta Business Partner, and build CRMs, ERPs and data pipelines in the same in-house team of 25+ specialists, so we know why GA4, ad platforms and your CRM disagree about conversions.
03
Your data, your accounts, your code
Dashboards, pipelines and warehouses are built in accounts you own, with admin logins in your name. You keep the code, data models and documentation. We work on rolling agreements; clients stay 1.6 years on average and rate us 4.9 on Clutch from 221 reviews.
Results we can put numbers on
Software and growth results from client reviews and case studies, with the full story behind each number.
"From designing a high-converting website to managing our SEO, Google Ads, and Google Business Profile, improveFX delivered exceptional results across every channel."
210%more qualified leads
185%organic and local traffic growth
92%keywords on page one
Maureen CappalloBroker and founder, Momentus Real Estate Group
"They revolutionized our online presence with a 60% increase in web traffic through strategic e-commerce SEO and content optimization."
60%more organic traffic
47%more sales
Eric NoahPresident, Eric Originals & Antiques Ltd.
"Visionstar Technologies' online presence transformed significantly with a 40% boost in customer engagement, all thanks to their exceptional website structuring and SEO tactics."
+40%qualified leads
32%lower cost per acquisition
Thomas MorelFounder, Visionstar Technologies
"Their strategic approach to our website and SEO resulted in a 60% increase in local inquiries, revolutionizing our automobile service business."
60%more local inquiries
87%more organic traffic
Mike SteffanFounder, Sabulski Window Tinting
"Their SEO strategy helped us achieve top search rankings, while their Facebook Ads campaigns drove a steady flow of qualified prospects."
Our software projects run from under $5,000 to $100,000+, depending on scope. One team's dashboard on one or two clean sources sits at the low end. Many sources joined in a warehouse, heavy cleanup, several audiences with row-level security, customer-facing embedding or live data push a project toward the high end.
Plan for running costs too: BI licenses (Power BI Pro lists at $14 per user a month, paid yearly), warehouse and hosting fees, and upkeep as your systems change. A custom web dashboard has no per-user fee, which matters when hundreds of staff or customers need access.
How long does it take to build a custom dashboard?
A first dashboard on data that is already accessible typically takes about 4 to 8 weeks. Multi-source platforms with a data warehouse usually take 2 to 4 months.
The longest step is rarely the charts. It is agreeing metric definitions, getting access to systems, and fixing data quality problems found in the audit. We deliver one audience's dashboard first, then add others on the same model.
Should we use Power BI, Data Studio (Looker Studio) or Tableau, or build a custom dashboard?
Use a BI tool for internal reporting when its licensing and refresh limits fit. Build custom when dashboards face customers, need live data, sit inside your product or would cost too much in per-user licenses.
Power BI suits Microsoft-based organizations, Data Studio suits Google marketing data at no license cost, and Tableau suits analyst teams. Many clients pair a BI tool for staff with a custom view for customers.
Can a dashboard show real-time data?
Yes. Custom dashboards can update within seconds using streaming data and WebSockets, and Power BI can query some sources live through DirectQuery.
Real time costs more to build and run, so we match refresh to how often decisions are made: minute-level data for operations and support, daily for finance. Imported Power BI models allow eight scheduled refreshes a day on Pro and 48 on Premium capacity.
What data sources can you connect?
Almost any system with an API, database or export: CRMs such as HubSpot and Salesforce, accounting and ERP systems, Shopify, GA4, ad platforms, support desks, spreadsheets and your own product database.
We use managed connectors where they are reliable and build custom ones where they are not. Every source is monitored, so a changed API or expired password raises an alert instead of a silently stale chart.
Do we need a data warehouse?
Not always. One or two clean sources can feed a BI tool directly. Once you join several systems, keep history or need fast queries, a warehouse such as BigQuery, Snowflake or PostgreSQL is usually worth it.
It also gives you one place for definitions and tests, and can feed forecasting later. We size it to your data volume, so running costs stay proportionate for a smaller business.
How do you make sure dashboard numbers are accurate?
We define every metric in writing, test data on every load, and reconcile dashboard totals against source systems before launch.
After launch, automated checks flag missing loads, sudden drops and duplicates. When a number looks wrong, the metric dictionary and documented transformations show exactly how it was calculated, which makes problems quick to trace.
Can different users see different data?
Yes. Access control sets who can open each dashboard, and row-level security filters the rows inside it, so each user sees only the regions, teams, accounts or customers they are allowed to.
In Power BI, row-level security applies to users with Viewer access, not to workspace admins, members or contributors, according to Microsoft Learn, so we set workspace roles carefully. Custom dashboards apply the rules in the API, so restricted data never reaches the browser.
Who maintains the dashboards after launch?
We can, on a rolling agreement covering monitoring, fixes, new metrics and changes to your source systems. Or your team can, with our documentation and training.
Systems change: a CRM field is renamed, a new store opens, an ad platform updates its API. Without maintenance, dashboards quietly drift out of date. Each month we report what changed, what broke and what we fixed.
Ready to plan your software?
Tell us how the work runs today, or book a strategy call with our team.
What we would build first, or what to buy and configure
A price range and timeline for your budget
A call with a specialist to plan the next steps, no obligation
A specialist replies personally 4.9 from 566 client reviews