



















Price analysis services that show where margin is won and lost

Our price analysis services use your own sales, cost and margin data, plus competitor prices, to show which price changes make money. They suit retailers, brands, distributors and B2B sellers who price many products. We track competitor prices, measure how demand responds to price, break margin down by product, customer and promotion, and put the findings in dashboards and alerts your team uses every week.

  • 170+projects delivered
  • 120+clients served across six markets
  • 4.9
    221 reviews
Price watch: 6 competitors2 alerts
Trail runner 2Ours $129Lowest $119Undercut
Rain jacketOurs $89Lowest $95Leading
Daypack 22LOurs $64Lowest $64Matched
Fleece midlayerOurs $72Lowest $58Undercut
Every morning
  • Competitor prices checked daily
  • Margin shown beside every price
  • Alerts when a pricing rule breaks

120+ businesses chose us for their digital growth

  • AkosMD Hospital
  • Amita Naithani Resort Wear
  • Momentus Real Estate Group
  • CleverBoss
  • MastersBuddy
  • Foley Mansfield
  • Pomegranate Health
  • Trunk Box Baby
  • Hunt Ortmann
  • Immigration Desk
  • Urology Partners
  • Jodi Carlton
  • Ecom Fashion
  • Eye on Security
  • Disability Solutions
  • One400
  • Eric Originals
  • Sabulski Window Tinting
  • History of Soccer

Price analysis at a glance

Price analysis services study your own sales, costs and margins alongside competitor prices to decide what to charge. Pricing surveys such as Van Westendorp or conjoint ask buyers what they would pay; our analysis uses your transaction data to show what customers actually paid and bought.

  • Product matching matters more than scraping volume: a wrong match produces a wrong price gap.
  • Elasticity needs real price variation in your history. Where there is too little, we run a controlled price test first.
  • Judge every price change on gross profit, never on revenue alone.
  • Where a dashboard answers the question, we build that first; models come in where they pay.
Best for
Retailers, ecommerce brands, distributors and B2B sellers with large catalogs, active competitors or frequent promotions
What you get
Competitor price tracking, elasticity estimates, margin and promotion analysis, dashboards, alerts and a written pricing review
Typical timeline
A first pricing review in 3 to 5 weeks; monitoring, dashboards and alerts live in 6 to 10 weeks, depending on data sources and competitor count.
Pricing
Driven by products, competitor sites, data sources and refresh frequency. Our AI projects run from under $5,000 to $100,000+, depending on scope. A fixed-price proof of concept on your own data starts from $3,000, so you see results before you commit to a build. Fixed quote after a free review of your pricing data.
Your data
A signed NDA before you share anything, a data processing agreement when you need one, a BAA for US patient data, and your data never trains any model outside your project.

What our price analysis services include

Six workstreams, scoped to your pricing questions. Most projects start with a pricing review, then add monitoring.

Get a free proposal

Competitor price monitoring

We collect public prices, stock, shipping costs and promotions from the competitor sites and marketplaces you name, daily or more often, matched by GTIN, MPN or attributes, with analyst review of uncertain matches. Google Shopping sellers also get benchmark prices from Merchant Center's Pricing tab.
Price elasticity analysis

Elasticity tells you how much unit sales change when price changes. We estimate it per product group, controlling for seasonality, promotions, stock-outs and marketing, with a confidence range. Where prices have barely moved, we design a price test to measure it.

Margin and price waterfall analysis

List price is rarely what you keep. We trace each sale to pocket price through discounts, rebates, coupons, shipping, payment fees and returns, showing which products, customers, channels and reps leak margin.

Promotion analysis

We measure each promotion against what would have sold anyway, net of cannibalization and the post-promotion dip, showing incremental units and gross profit, so next quarter's calendar keeps only the offers that pay back.

Pricing dashboards

Price index by competitor, margin by category, promotion results and price history on one screen, refreshed automatically, in Power BI, Data Studio (formerly Looker Studio) or Tableau on BigQuery or your warehouse, or as a custom dashboard inside your own systems.

Price alerts and guardrails

Alerts reach Slack, Teams or email when a competitor undercuts a key product past your threshold, a reseller breaks your minimum advertised price, or a cost change pushes margin below its floor. Our report and analytics automation work schedules weekly summaries.

What competitive pricing analysis changes for the business

Good price analysis shows up in decisions you can explain to finance.

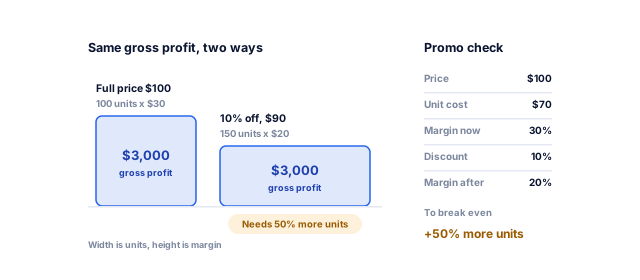
Two areas of equal gross profit, one hundred units at a thirty dollar margin at full price and one hundred and fifty units at a twenty dollar margin after a ten percent discount, beside a promotion check showing fifty percent more units are needed

Discounts judged on gross profit

A discount that lifts revenue can still lose money. On a product with a 30% gross margin, a 10% price cut leaves 20% margin, so you need 50% more units to earn the same gross profit. We run this math on every planned discount, with your real costs, before it goes live.

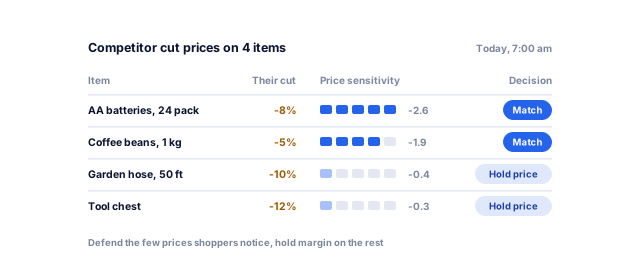
Four products a competitor undercut, each with its price sensitivity, where the known value items shoppers compare closely are matched and the rest hold their price and margin

Knowing when not to match a competitor

Not every undercut deserves a response. Elasticity estimates separate the few known value items shoppers compare closely from products where availability, brand or delivery matter more, so you defend the prices shoppers notice and hold margin elsewhere.

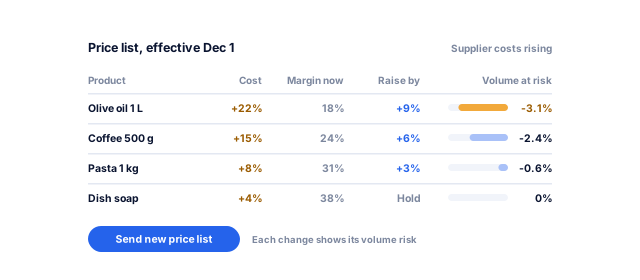
A new price list where each product’s supplier cost increase, current margin and proposed price rise is shown with the share of volume it puts at risk, ready to send once reviewed

Cost increases passed on with evidence

US consumer prices rose 3.7% in the 12 months to September 2026, and the energy index 20.4%, according to the Bureau of Labor Statistics. Margin analysis shows which products need an increase, and elasticity estimates the volume each puts at risk before the new price list goes out.

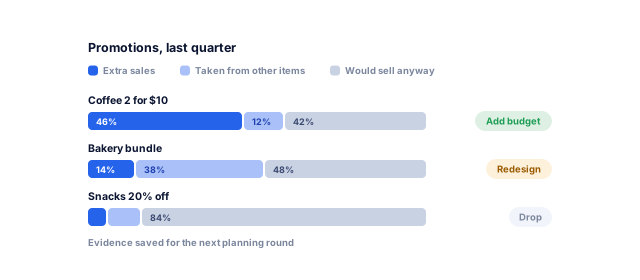
Three promotions split into extra sales, sales taken from other items and sales that would have happened anyway, with one given more budget, one redesigned and one dropped

Promotions that pay for themselves

Many promotion calendars repeat last year's offers because nobody measured them. Counting incremental sales and cannibalization usually shows a few promotions doing most of the work; those get more budget, and the rest are redesigned or dropped.

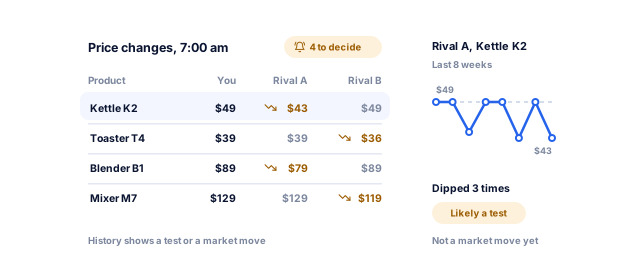
A morning list of competitor price changes that need a decision, with a rival’s cut on one kettle opened to its eight week price history, which shows repeated short dips that look like a test rather than a market move

Fewer hours spent checking prices by hand

Category managers who copy competitor prices into spreadsheets spend the week collecting, not deciding. Automated collection and alerts give them a short list of changes to decide each morning, and the history to tell a competitor's test from a market move.

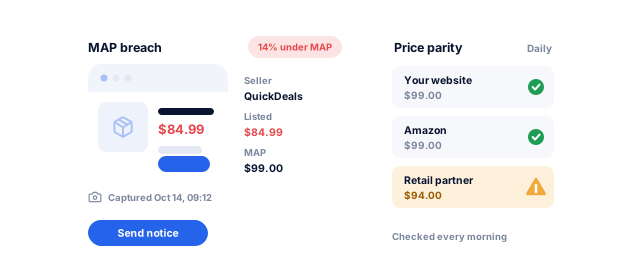
A marketplace listing captured with a dated screenshot showing a seller pricing below the minimum advertised price, beside a parity check of the same product on the brand website, Amazon and a retail partner

Consistent prices across channels

Brands selling through retailers and marketplaces need to know where products are advertised below agreed prices. MAP monitoring flags each breach with a dated screenshot and the seller's name, and parity checks keep your website, Amazon and retail partner prices in line.

Not sure your data is good enough for pricing analysis?

Tell us what you need. We look at your prices, sales and competitors, and send a written plan for the analysis to run first, with a price range and timeline.

What do you need?

Free, with no obligation. Rather talk? Book a 30-minute call

Our price analysis process, from data review to live alerts

  1. Pricing data review

    We pull 12 to 24 months of transaction-level sales, costs, list and net prices, promotions and stock history, check for gaps and missing costs, and agree the pricing questions to answer.

    • Data quality report
    • Agreed pricing questions
    • Scope and fixed quote
    You know what your data can answer
  2. Competitors and product matching

    We agree the competitors and channels that matter, then match products by GTIN, MPN and attributes, scoring each match and reviewing uncertain ones by hand.

    • Competitor and channel list
    • Match table with confidence scores
    • Collection schedule
    Like-for-like price comparisons
  3. Baseline analysis

    We calculate your price index, build the margin waterfall, measure past promotions and estimate elasticity per category, then rank opportunities by gross profit impact, with the uncertainty stated.

    • Pricing review report
    • Elasticity estimates with ranges
    • Ranked opportunity list
    A short list of changes worth making
  4. Test before rollout

    For the largest changes we design a controlled test: a holdout group of products, stores or regions, with the success metric and duration agreed in advance.

    • Test design
    • Results readout
    Evidence before a wide rollout
  5. Dashboards and alerts

    We build the dashboard and pipeline, set alert thresholds with your team and document every metric, with training and a written guide so it stays in use.

    • Pricing dashboard
    • Alert rules
    • Pipeline and metric documentation
    Pricing signals in front of the right people
  6. Monthly review and refinement

    Each month we report market moves, your changes and their effect on margin. Elasticities are re-estimated quarterly, and where forecasting would help, we plan the step to a prediction model.

    • Monthly pricing report
    • Quarterly elasticity refresh
    • Roadmap for the next quarter
    Pricing that keeps up with the market

Price analysis for your type of business

The questions our price analysis services answer change with how you sell.

01 / 05

Ecommerce and marketplace sellers

Online sellers compete on the total price a shopper sees, including shipping and who holds the Amazon Buy Box. Merchant Center benchmark prices feed your price index, and findings go to your Google Ads management team for Shopping campaigns. See our work for ecommerce businesses.

02 / 05

Brands and manufacturers

Brands need to see how every retailer and marketplace prices their products. We track advertised prices against your MAP policy, flag unauthorized sellers and record discount depth by retailer and season, giving your sales team dated evidence for partner talks.

03 / 05

B2B distributors and wholesalers

In B2B, negotiated discounts matter more than list prices. We analyze quotes and invoices to show price dispersion across similar customers and how far each rep discounts, then build discount bands and approval rules into your ERP software or CRM so every quote follows them.

04 / 05

SaaS and subscription businesses

Subscription pricing is about plans, tiers and discounts. We analyze trial conversion by plan and price point, renewal discounts, upgrade and downgrade paths, and churn by plan. Where churn is the bigger problem, customer churn prediction flags at-risk accounts before a price change reaches them.

05 / 05

Real estate and rentals

Property pricing depends on comparables. We gather listing data from sources you may use, normalize price per square foot or meter, and relate list price to days on market and final price. For valuations rather than comparisons, price prediction models take the next step.

Spreadsheets, pricing software or a managed price analysis service?

Spreadsheets, price intelligence software and outside analysts each fit a different stage.

Book a strategy call
FactorSpreadsheets and manual checksPricing software (SaaS)Managed service (improveFX)
Fits best whenA small catalog and a handful of competitorsA large retail catalog and an in-house pricing teamMixed data, B2B pricing or questions software does not answer
Competitor dataManual checks that go stale quicklyAutomated collection; matching quality varies by vendorAutomated collection with analyst-reviewed matching
Elasticity and promotionsRarely attemptedOften built in, with methods you cannot inspectDocumented methods with confidence ranges
Cost modelStaff timeMonthly license, usually by products and sites trackedProject or monthly fee; no license lock-in
Time to first resultImmediateWeeks, plus integration work3 to 5 weeks for the first review
Who owns the outputYouData often stays in the vendor platformYou own the data, code and dashboards
Main riskErrors and outdated pricesPaying for features nobody usesFindings pay off only when acted on; alerts and monthly reviews keep them in use

Based on price monitoring and optimization vendor pages we reviewed in October 2026 (none showed prices) and our own project scoping. We can also analyze exports from a pricing tool you already pay for.

Your price analysis project, week by week

A typical project with monitoring; a one-off review ends at week 5, and price tests add their own weeks.

Book a strategy call
  1. 1Weeks 1 to 2

    Data review and product matching

    • Sales, cost, price and promotion data checked for gaps
    • Pricing questions agreed, with scope and a fixed quote
    • Competitor list and match table with confidence scores
    • From you: 12 to 24 months of sales data and access

    By week 2, you know what your data can answer.

  2. 2Weeks 3 to 5

    Baseline pricing review

    • Price index by competitor and margin waterfall
    • Past promotions measured on incremental gross profit
    • Elasticity estimates per category, with confidence ranges
    • From you: a pricing owner to review findings and pick changes

    By week 5, you have a written pricing review with ranked changes.

  3. 3Weeks 6 to 10

    Dashboards, alerts and price tests

    • Pricing dashboard on an automated data pipeline
    • Alerts for undercuts, MAP breaches and margin floors
    • Controlled test designed for the largest price change
    • From you: alert thresholds, test sign-off and BI access

    By week 10, your team gets pricing signals every morning.

What you sign off, step by step

You approve each stage before the next one starts, and nothing goes live until it beats the agreed baseline on data it has never seen.

Along the way you get

  • A baseline to beat before any model is built
  • Results on data the model has never seen
  • A human look at the errors, not just the score
  • Monitoring and retraining after launch
Model go-live checklistSample
  1. 1Use case and success metricApproved
  2. 2Data audit and accessDone
  3. 3Baseline to beatMeasured
  4. 4Evaluation on unseen dataPassed
  5. 5Human review of errorsDone
  6. 6Privacy and security reviewPassed
  7. 7Connected to your toolsLive
  8. 8Monitoring and retraining planSet up
A sample of the checklist. Every project gets its own, signed off with you.

Yours to keep, always. Everything is set up in your name, and if you leave we remove our access and hand over the documentation.

  • Source code and repository
  • Trained models and prompts
  • Your data and its labels
  • Cloud and model provider accounts
  • Documentation and evaluation reports

Who price analysis services from improveFX are for

We help businesses that set many prices and want every change backed by their own sales data.

Book a strategy call

A good fit if

  • Retailers and ecommerce brands with large catalogs and active competitors
  • Brands that need MAP monitoring across retailers and marketplaces
  • B2B distributors whose margin leaks through deal-by-deal discounts
  • Teams planning price increases or promotions who want evidence first

We can also help when

  • Your prices have barely changed in years: we design a controlled price test that creates the evidence for elasticity
  • You already use pricing software: we work from its exports and add the elasticity, promotion and margin analysis
  • Your catalog is small: we start with a one-off pricing review and a simple dashboard
  • You need forecasts too: our price prediction model development team builds them on the same data

Why work with improveFX on pricing analytics

01

Analysts and engineers on one team

Price analysis fails when the pipeline breaks or the dashboard goes stale. Our 25+ in-house specialists cover data collection, Python analysis, BI and software, so one team owns the chain, and our Python development and software teams build any system change a finding needs, such as ERP discount rules.

02

The right tool for each pricing question

Where a dashboard answers the question, we build the dashboard; where it takes an elasticity model or a forecast, we build that; where prices have barely moved, we design a price test. Methods are written down, and rolling agreements with monthly reporting keep the work earning its place.

03

Your data, code and dashboards

Every scraper, match table, query and dashboard runs in accounts you own and stays yours if we part ways. Data handling is agreed in writing and designed for GDPR, UK GDPR, US state privacy laws, Canada's PIPEDA, Australia's Privacy Act and India's DPDP Act. Clients stay 1.6 years on average; see our case studies.

Results we can put numbers on

These results come from our SEO, paid media and software projects, measured in each client's own analytics. For proof in your own business, start with a free review of a sample of your sales and competitor data.

See all case studies
MastersBuddyStudy abroad consulting

160+

keywords in Google's top 10

A new consultancy broke into one of India's most competitive markets

Read the case study
AkosMDHealthcare, Arizona

+57%

patient footfall

An Arizona hospital became the first call for urgent care

Read the case study
Eric OriginalsJewelry ecommerce

+1,900%

organic traffic

A struggling jewelry website became a steady source of buyers

Read the case study

What our clients say

"From designing a high-converting website to managing our SEO, Google Ads, and Google Business Profile, improveFX delivered exceptional results across every channel."
210%more qualified leads
185%organic and local traffic growth
92%keywords on page one
Maureen CappalloBroker and founder, Momentus Real Estate Group
"They revolutionized our online presence with a 60% increase in web traffic through strategic e-commerce SEO and content optimization."
60%more organic traffic
47%more sales
Eric NoahPresident, Eric Originals & Antiques Ltd.
"Visionstar Technologies' online presence transformed significantly with a 40% boost in customer engagement, all thanks to their exceptional website structuring and SEO tactics."
+40%qualified leads
32%lower cost per acquisition
Thomas MorelFounder, Visionstar Technologies
"Their strategic approach to our website and SEO resulted in a 60% increase in local inquiries, revolutionizing our automobile service business."
60%more local inquiries
87%more organic traffic
Mike SteffanFounder, Sabulski Window Tinting
"Their SEO strategy helped us achieve top search rankings, while their Facebook Ads campaigns drove a steady flow of qualified prospects."
55%more organic traffic
4.7xreturn on ad spend
75%keywords on page one
Amita NaithaniCo-founder, Amita Naithani Resort Wear

Price analysis questions, answered

Not seeing yours? Ask us directly and a specialist will reply personally.

What do price analysis services include?

Price analysis services include competitor price monitoring, price elasticity analysis, margin and price waterfall analysis, promotion analysis, dashboards and alerts.

We scope the project around your pricing questions after looking at your data. A retailer facing aggressive competitors usually starts with monitoring and a price index. A distributor with negotiated prices gets more from a margin waterfall and discount analysis.

How much do price analysis services cost?

Our AI projects run from under $5,000 to $100,000+, depending on scope. A fixed-price proof of concept on your own data starts from $3,000, so you see results before you commit to a build. A one-off pricing review on clean sales data sits at the low end; daily monitoring of thousands of products across many marketplaces, ERP integration or a forecasting model moves toward the high end.

Running costs are cloud hosting, warehouse queries, BI licenses and upkeep of the price collectors. We give a fixed quote after a free review of a sample of your data, with collection, analysis and dashboards as separate lines.

How long does a pricing analysis project take?

A first pricing review usually takes 3 to 5 weeks. Ongoing competitor monitoring with dashboards and alerts typically goes live in 6 to 10 weeks.

Most of that time goes into data access, cleaning and product matching, so consistent product codes and per-item costs speed things up. A controlled price test adds its own duration, often several weeks, so the result covers normal trading.

What data do you need for price elasticity analysis?

You need transaction or daily sales data by product, the price actually paid, costs, and a record of promotions and stock-outs, ideally covering 12 to 24 months.

Prices must also have changed: if a product sold at one price for two years, no method can measure how buyers would react to another. For those products we design and run a controlled price test.

How accurate is competitor price monitoring?

Accuracy depends mostly on product matching. Matching by GTIN or MPN is reliable; matching by name and attributes needs human review.

We report match coverage and confidence for every competitor, spot-check collected prices against live pages each week, and flag different pack sizes or bundles. When a competitor redesigns its site, collection can break, so monitoring alerts you to missing data as well as price changes.

Is competitor price monitoring legal?

Collecting prices that competitors display publicly is common practice, but rules on automated collection, site terms and personal data vary by country, so we review each source first.

We collect product and price data only, never personal data, rate-limit requests and respect access restrictions. Independent monitoring differs from agreeing prices with competitors, which competition law prohibits, and your counsel can review the source list in sensitive markets.

What is the difference between price analysis and price prediction?

Price analysis explains your current and past prices: where you stand, what changes did and where margin leaks. Price prediction forecasts future prices, or demand at a given price.

Analysis usually comes first, because it builds the clean data and shared definitions a forecast depends on. To forecast commodity costs, property values or demand at different prices, see our price prediction model development service.

How do you measure whether a price change worked?

We compare products, stores or regions that got the change with a similar group that did not, over an agreed period, and judge the result on gross profit.

Before-and-after comparisons mislead, because seasons, competitors and marketing shift too. The metric and test length are agreed before the test starts, so nobody picks the flattering number afterward, and results reach the monthly report with raw figures attached.

Can price analysis help our Google Shopping performance?

It can. Merchant Center shows a price gap against a benchmark price for products with a valid GTIN, and Shopping campaigns compete on the price shoppers see.

Google's help notes that its sale price suggestions require reported purchase conversions, use the past 7 days of data and do not guarantee results. We combine those benchmarks with your margins and elasticity for your paid search team.

Which tools and platforms do you work with?

We work with Shopify, WooCommerce, Amazon Seller Central, Google Merchant Center, common ERPs and CRMs, and BI tools such as Power BI, Data Studio and Tableau.

Data usually lands in BigQuery or your warehouse, analysis runs in Python, and an existing pricing tool's exports are used rather than replaced. Send your setup through the contact page and we will suggest the lightest option.

Ready to put AI to work?

Tell us what you want AI to do with your data, or book a strategy call with our team.

  • What AI can do with your data, and how to measure it
  • A fixed-price proof of concept on your data, from $3,000
  • A call with a specialist to plan the next steps, no obligation
Vikash Kumar PalRoshan Kumar JhaAbhishek Kumar Jha A specialist replies personally 4.9 from 566 client reviews
What do you need help with?

Pick all that apply.

Next, a few details about your business on our contact page. It takes about a minute.

Prefer to talk now? Book a strategy call