We build customer churn prediction software on your own data, so your team knows who is slipping away, why it is happening, and what to do about it weeks before the cancellation lands. No generic health scores, no rented platform. You get a prediction and prevention system wired into your CRM that your business fully owns.
Companies that chose us for their digital transformation



















Most retention programs run on hindsight. By the time a dashboard flags a drop in logins or a missed renewal, the decision to leave was made weeks ago. Predicting customer churn asks a harder question: which specific accounts are drifting right now, and what is pulling them away? Here are the four places customer churn prediction usually breaks down before it ever reaches your retention team.

Churn rate, NPS, and renewal reports describe the past. They confirm losses you already absorbed instead of naming the accounts still worth saving.

Rule-based scores weight signals by opinion, not evidence. A model learns the actual patterns that preceded every cancellation in your own history.

Usage sits in the product, tickets in the helpdesk, and payments in billing. Churn risk only becomes visible once those signals are joined together.
A risk percentage in a report changes nothing. Predictions need a reason, an owner, and a next step delivered inside the tools your team uses.
A telecom customer gives you months of warning. An eCommerce buyer just stops coming back and never cancels anything. The signals that predict churn in one industry are noise in another, which is why transplanted models underperform. We build customer churn prediction software around how attrition actually works in your market, using the events, timeframes, and definitions that fit your business.
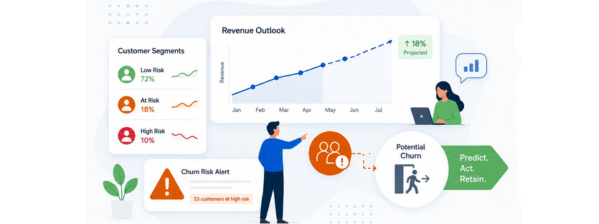
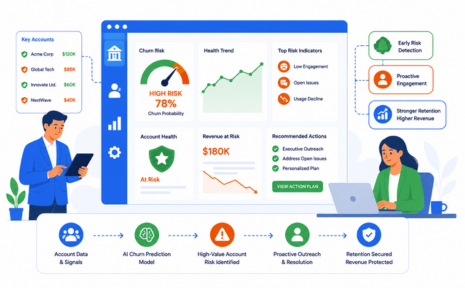
SaaS churn is visible in product telemetry long before the cancellation form. Declining seat activation, features abandoned after onboarding, support tickets that go unanswered, and a champion who stops logging in are all early warnings. AI tools for predicting SaaS customer churn work best when they read this behavior at the account level, not the user level, because one disengaged admin can end a whole contract.

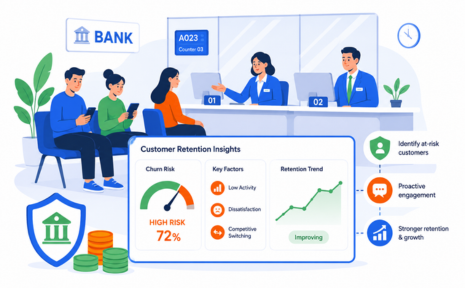
Bank customer churn prediction is rarely about a closed account. It starts when direct deposits move, balances drift toward a competitor, card usage thins out, or a mortgage inquiry appears on file. Attrition is silent and gradual, and regulatory constraints shape what you can model and how decisions must be explained. We build for auditability, so every risk score can be justified.

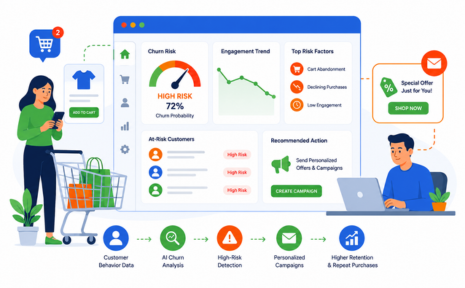
E-commerce has no cancellation event, so churn has to be defined before it can be predicted. We model the gap between purchases against each customer’s own rhythm, because a lapsed monthly buyer and a lapsed annual buyer look identical in a raw report. Category mix, discount dependence, return behavior, and first-repeat timing usually carry more predictive weight than total spend.
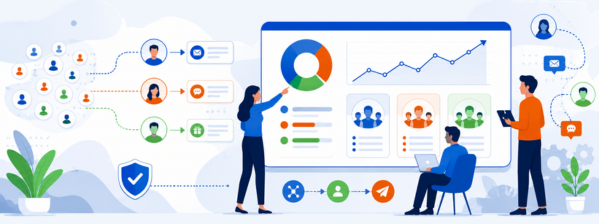
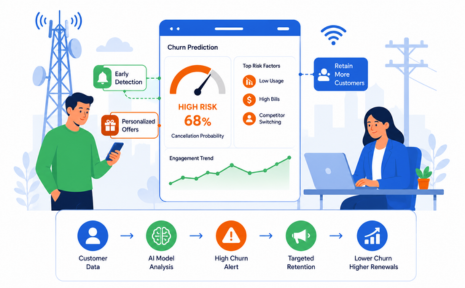
Telecom churn clusters around contract anniversaries, price changes, and service faults, which makes timing as important as risk. Dropped calls, throttled speeds, repeat technical complaints, and competitor coverage in a customer’s postal area all move the needle. Because volumes are high and margins are thin, the model has to rank customers by save value, not just churn probability, so retention budget goes where it earns.
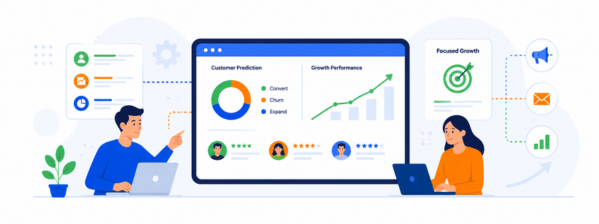
Insurance lapse is seasonal and price-driven, so renewal windows are the moments that matter. Claims history, premium increases at renewal, policy downgrades, and quiet contact with comparison sites signal intent to leave. Membership organizations follow a similar pattern, where declining facility visits or unused benefits precede non-renewal. We model risk against the renewal calendar so outreach lands before the decision is made.

Patient attrition shows up as missed follow-ups, unfilled prescriptions, and appointments that are never rebooked. Predicting it means combining scheduling data, visit gaps, and communication history while keeping every record inside a compliant environment. We build these systems with strict access controls and de-identified training pipelines, so clinical teams get useful risk flags without moving protected health information anywhere it should not go.
Get a free proposal with real numbers, honest timelines, and no lock-in. Judge us on that.
Most of the work in customer churn predictive analytics is not the model. It is defining churn correctly, joining messy data, and putting predictions in front of people who can act on them. Here is the exact sequence we follow, what you receive at each stage, and where your team stays involved.
We map every system holding customer signals and agree on what churn means in your business. A vague definition produces a useless model, so this decision gets made first, together.

Product usage, billing, support, and CRM records are joined into one customer timeline. This is the heaviest part of any build, and it is where most churn projects quietly fail long before modeling begins.

We test several algorithms against your data, handle class imbalance properly, and report accuracy in plain numbers. If a model cannot beat your current process, we say so before you invest further.

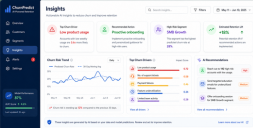
Every risk score carries the reasons behind it. Your team sees which behaviors pushed an account toward leaving, so outreach addresses the real problem instead of guessing at it on a call.

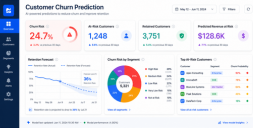
Scores, drivers, and risk tiers are written into your CRM, dashboards, and alerts. Retention owners get a daily working list, not a report they have to remember to open each week.

Customer behavior changes and accuracy decays with it. We track live performance against real outcomes, retrain on an agreed schedule, and adjust features as your product, pricing, and customer base evolve.
These are the questions that come up in every first technical call, answered the way we would answer them live. Nothing here is a sales answer. If you are weighing a custom customer churn prediction software build against an off-the-shelf platform, the detail below is usually where the real difference becomes obvious.
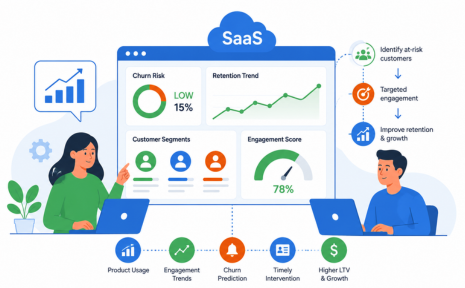
Two to three years of history is ideal, but we have built useful models on less. What matters more is churn volume: a few hundred genuine churn events give the model something to learn from, even if your total customer count is modest. If your history is thin, we start with a simpler, explainable model and strengthen it as data accumulates.
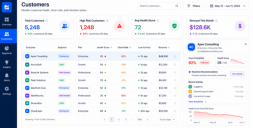
A customer churn prediction dataset is a single timeline per customer, built from sources that rarely sit together. Typically, that means product or transaction activity, billing and payment history, support tickets and response times, onboarding milestones, contract terms, and engagement with your emails or app. We add derived signals too, such as change in usage over the last thirty days rather than usage alone.
It is normal, and it is most of the job. Duplicate records, inconsistent customer IDs, missing timestamps, and fields that changed meaning three years ago are things we expect to find. The data audit exists to surface them early so nothing derails the build later. We fix what can be fixed and document what cannot, so you know exactly what the model is working with.
We usually start with gradient boosting methods like XGBoost or LightGBM, benchmark them against logistic regression for explainability, and use survival models when timing matters as much as risk. On accuracy, be skeptical of anyone promising ninety percent. A well-built churn model commonly lands in the seventy to eighty percent AUC range, and that is more than enough to change retention outcomes.
Class imbalance is the norm, not an obstacle. When two or three percent of customers churn in a period, a model that predicts nobody churns is technically ninety-seven percent accurate and completely worthless. We handle this with resampling, class weighting, and threshold tuning, then measure with precision, recall, and lift instead of raw accuracy, so results reflect real retention value.
Public datasets are useful for learning and for proving a concept quickly. A bank customer churn prediction dataset from Kaggle can show stakeholders what the output looks like, and we sometimes use one in a workshop. It will not predict your churn, because it holds none of your products, pricing, or customer behavior. Treat it as a demo, then build on your own data.
Most churn tools stop at the score and hand the hard part back to you. We treat customer churn prediction and prevention as one system: risk is scored, the reason is attached, the right play is triggered, and the save is measured. Without that last step, nobody can prove the model earned its budget.
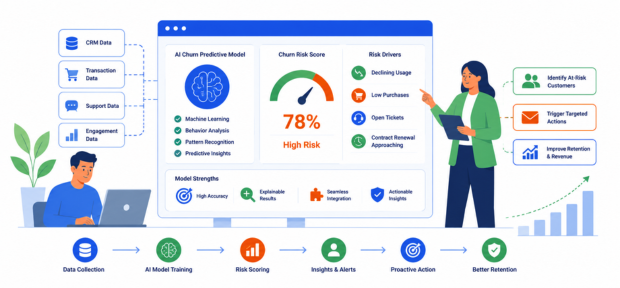
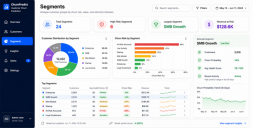
A ranked list is not a plan. We segment accounts by risk and by value, because a high-risk customer worth two hundred dollars and one worth eighty thousand deserve different responses. Each tier gets an owner, a channel, and a response window written into your CRM, so a flagged account triggers real work instead of sitting in a dashboard nobody opens.
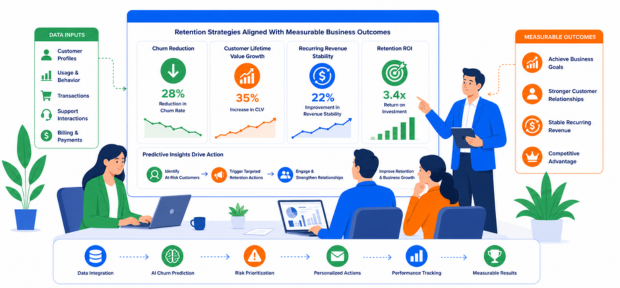
Discounting every at-risk customer is expensive and often unnecessary. When the model shows an account stalled during onboarding, the answer is enablement, not a price cut. Unresolved support tickets call for a service escalation. Fading usage after a champion left calls for a new relationship. Because every score carries its drivers, your team picks the play that fits the problem.
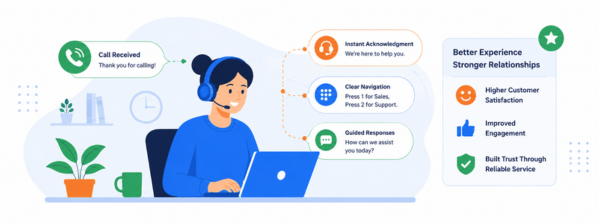
Retention campaigns are easy to declare successful because some flagged customers would have stayed anyway. We hold back a small control group from each intervention and compare outcomes, so you see how many accounts were actually saved and what each save cost. That number is what justifies the next quarter’s retention budget, and it is the one most teams cannot produce.
Churn prediction shares its data foundation with several other models we build. Once customer timelines, event pipelines, and CRM integrations are in place, adding a second model costs a fraction of the first. These are the services our clients most often pair with customer churn prediction software, in the order they usually add them.
The hardest part of any machine learning project is the plumbing beneath it. We build that layer once, then reuse it. Teams that start with churn often add a second model soon after, because the pipeline, governance, and integrations are already running.
Forecasting beyond churn: demand, revenue, inventory, and capacity. The same customer and transaction pipelines feed models that answer what happens next across your business, not only your retention numbers.
Churn models rank who is leaving. Lead scoring ranks who is worth acquiring. Run together, they tell your team where every hour of effort earns the most.
Support tickets, reviews, and survey text hold churn signals that numbers miss. We turn that language into structured features your prediction model can actually use.
Relevance is retention. Engines that surface the right product, plan, or content keep customers engaged, which lowers the number of accounts your churn model ever has to flag.
Pricing drives more attrition than most teams realize. We model how price changes affect renewal and repeat purchases, so increases land without triggering avoidable churn.
Slow support is a churn driver. Conversational assistants resolve routine issues in seconds and log every interaction as a clean signal your retention models can learn from.
The technical questions are answered above. These are the commercial ones: what it costs, how long it takes, who owns what, and what happens after launch. If something you need is not covered here, ask us directly, and we will give you the same answer we would give a client.