
Data pipeline automation
Native connectors first, then Supermetrics or Fivetran, then custom API scripts, from ad platforms, GA4, CRMs, Shopify and finance tools. Larger setups land in BigQuery.
Our reporting automation services connect Google Ads, Meta, GA4, HubSpot, Salesforce, Shopify, QuickBooks, Xero and the other systems your numbers live in, and turn them into dashboards and reports that update themselves, for teams tired of copying data into spreadsheets.
 4.9
 Written by Abhishek Kumar, Content Writer



















Report and analytics automation uses data pipelines, scheduled refreshes and alerts to move data from ad platforms, CRMs, analytics and finance tools into dashboards. Reporting automation services build and monitor those pipelines.
From source to decision.
Get a free proposalNative connectors first, then Supermetrics or Fivetran, then custom API scripts, from ad platforms, GA4, CRMs, Shopify and finance tools. Larger setups land in BigQuery.
A metric dictionary fixes what counts as a lead, whether revenue is net of refunds and which currency applies, so every report shows the same number.
A one-page summary for leadership and detail for each team. Where tools fall short, our custom dashboard development team builds it.
A Monday summary by email, a daily snapshot in Slack or Teams, a month-end PDF pack with commentary.
Alerts flag overspending campaigns, falling lead volume or broken tracking, and go to the person who can act.
Checks confirm each source refreshed on time and totals match the source. Power BI shared-capacity refreshes must finish in under two hours, so models are built to fit.
What changes once your reports run themselves.
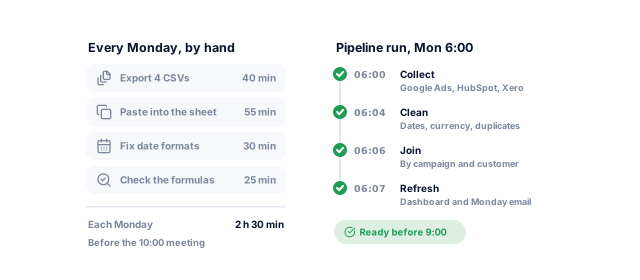
In FERF's 2026 survey of 116 finance leaders, 36% of organizations said senior staff spend 31% to 50% of their time on manual data firefighting (CPA Practice Advisor). Pipelines take that over.
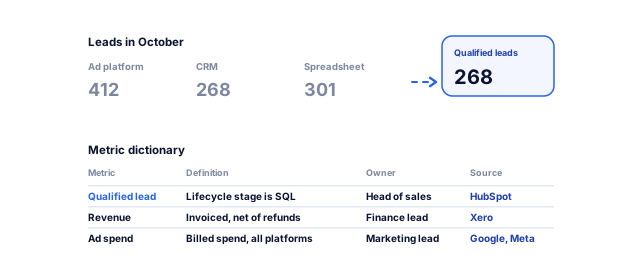
Each metric has a written definition, an owner and a source anyone can check.
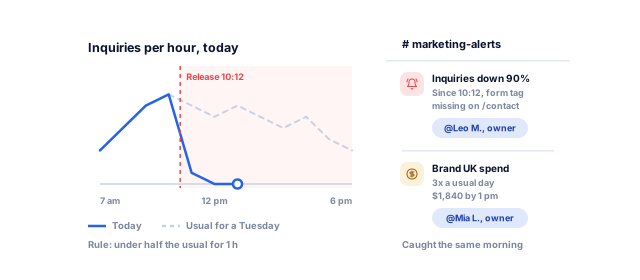
Broken tracking or an overspending campaign shows up within a day. Our PPC management team uses the same alerts to protect client budgets.
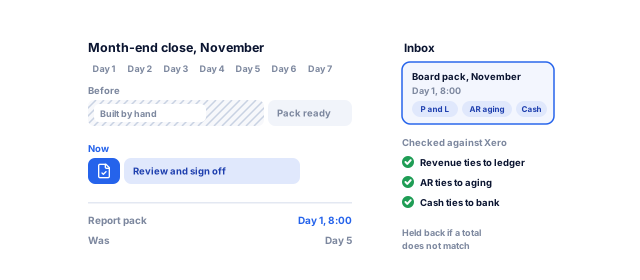
FERF also found 40% of organizations take a week or longer to close the month. Automated packs remove the copying, and invoice and billing automation speeds up the transactions upstream.
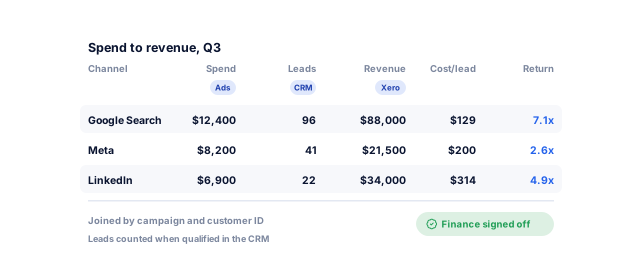
Ad data joined to CRM and accounting data shows cost per qualified lead and return by channel.
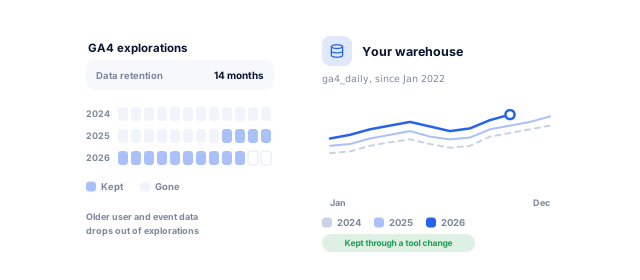
GA4 keeps exploration data for 2 or 14 months. Daily data in your own warehouse keeps year-on-year comparisons through any tool change.
Tell us what you need. Send the reports your team builds by hand, and we show which ones can run themselves, what data they need, and a price range and timeline.
We list every recurring report, who builds it, the hours and the sources.
What to automate firstWe agree definitions and owners, sketch dashboards with their users, and settle tools.
Agreed meaning for every numberWe connect sources and build the shared model in your accounts, with every pipeline documented.
Data flowing on scheduleWe build role-based dashboards, scheduled delivery by email, Slack or Teams, and alert rules.
Reports that arrive by themselvesWe reconcile past periods against source systems, explain differences, and owners sign off.
Numbers people trustFailed refreshes alert a named owner and land in a run log. Support plans from $99 a month cover monitoring, fixes when a connected tool changes, and small changes.
Reporting that stays accurateNumbers each team needs.
Ads, GA4 and Search Console joined to CRM leads, in client reports like those our SEO services clients receive.
Pipeline, conversion and forecast from HubSpot, Salesforce or Zoho, with stalled deals flagged, often with our CRM automation services.
Revenue, margin, cash and budget from QuickBooks, Xero and Stripe, with drill-down to transactions and, later, predictive analytics.
Return on ad spend by product, with alerts when best sellers run low while ads still run. See our work with ecommerce businesses.
Appointments, no-shows and revenue for every location, without patient-level data. Clinics on Nabhaya Clinic get reports built in.
What each option costs to run.
Book a strategy call| Option | Cost | Refresh and limits | Best for | Watch out for |
|---|---|---|---|---|
| Google Data Studio (formerly Looker Studio) | No-cost; paid Pro edition | Google Ads data every 12 hours | Marketing reports | Slow with large blended data |
| Power BI Pro or Premium Per User | $14 or $24 per user a month, billed yearly | Up to 8 or 48 refreshes a day | Microsoft 365 teams, finance | Cost grows per user |
| Warehouse (such as BigQuery) plus BI tool | Usage-based storage and queries | As often as pipelines run | Many sources, long history | Query costs need watching |
| Custom dashboard | Build cost plus hosting | Real time | In-product analytics | Higher upkeep |
Microsoft and Google documentation, checked October 2026. Looker Studio is now Data Studio. Connector tools such as Supermetrics or Fivetran bill separately.
A first dashboard in 2 to 4 weeks; warehouse builds by week 12.
Book a strategy callBy week 2, you have agreed definitions and a plan.
By week 4, your most time-consuming report runs itself.
By week 12, every agreed report runs in your accounts.
You approve each stage before the next one starts, and nothing goes live until it has run cleanly on your real records.
Yours to keep, always. Everything is set up in your name, and if you leave we remove our access and hand over the documentation.
From one weekly report to a full warehouse.
Book a strategy callAs a Google Premier Partner, Meta Business Partner and Microsoft Advertising Partner running ads ourselves, we know how platforms count conversions.
One team connects the APIs, models the data, builds dashboards and fixes tracking. Our Google Cloud team sets up BigQuery in your account.
Dashboards, data connections, warehouses and credentials stay in your accounts, documented so any team can run them. Clients rate us 4.9 on Clutch from 221 reviews.
These numbers come from our SEO, marketing and software work, measured in each client’s own analytics. For automation, your first numbers come from test runs on your own records before anything goes live.
See all case studies
AkosMDHealthcare, Arizona
+57%
patient footfall
MastersBuddyStudy abroad consulting
160+
keywords in Google's top 10
Eric OriginalsJewelry ecommerce
+1,900%
organic traffic
"From designing a high-converting website to managing our SEO, Google Ads, and Google Business Profile, improveFX delivered exceptional results across every channel."
 Maureen CappalloBroker and founder, Momentus Real Estate Group
"They revolutionized our online presence with a 60% increase in web traffic through strategic e-commerce SEO and content optimization."
 Eric NoahPresident, Eric Originals & Antiques Ltd.
"Visionstar Technologies' online presence transformed significantly with a 40% boost in customer engagement, all thanks to their exceptional website structuring and SEO tactics."
"Their strategic approach to our website and SEO resulted in a 60% increase in local inquiries, revolutionizing our automobile service business."
"Their SEO strategy helped us achieve top search rankings, while their Facebook Ads campaigns drove a steady flow of qualified prospects."
 Amita NaithaniCo-founder, Amita Naithani Resort Wear
Not seeing yours? Ask us directly and a specialist will reply personally.
Our automation projects run from under $2,000 to $50,000+, depending on scope, and a fixed-price first automation, such as one report automated end to end, starts from $500. More sources, data cleanup, a warehouse and more dashboards move a project up the range.
Running costs are billed by the vendors: BI licenses, connector tools such as Supermetrics or Fivetran, and warehouse queries. Support plans start from $99 a month.
A first dashboard from existing sources usually takes 2 to 4 weeks, and multi-source reporting with a warehouse, alerts and validation 6 to 12 weeks.
The slowest part is often agreeing metric definitions and getting access to every source. We automate your most time-consuming report first, so your team gets hours back well before the whole project comes to an end.
Data Studio, formerly Looker Studio, suits marketing teams working mostly with Google data and is no-cost to share with clients. Power BI suits Microsoft 365 organizations and finance reporting with complex models, at $14 for Pro or $24 for Premium Per User per user a month billed yearly. Many businesses use both, and we build on whichever you already pay for.
Yes. We rebuild each spreadsheet's logic in a data model and connect it to the original sources. Spreadsheets often hide manual adjustments, so we document each one during the audit and agree whether it becomes a rule, a lookup table or a step a person keeps. Excel can stay as an output for anyone on your team who prefers it.
As often as sources and licenses allow, from every few minutes to a few times a day. Power BI Pro allows up to 8 scheduled refreshes a day and Premium Per User up to 48, while the Google Ads connector in Data Studio refreshes every 12 hours. We match refresh rates to how fast someone would act on a change.
With a few sources and modest volumes, Data Studio or Power BI connect directly, and we set that up. With many sources, long history or heavy joins, we build a warehouse such as BigQuery in your own cloud account. It also keeps data beyond platform limits, such as GA4's 2 or 14 months, and bills storage and queries by usage.
You do. Dashboards, data connections, warehouses and credentials live in your own Google, Microsoft or cloud accounts, with our access added as a user you can remove at any time. Every pipeline and metric is documented, so your team or another provider can run and change it, and everything keeps running if you ever decide to stop working with us.
An alert tells a named owner about failed or late refreshes, and every run is logged, so nobody finds out from a wrong number in a meeting. Common causes are expired logins, changed permissions and API changes. Support plans, from $99 a month, cover monitoring, fixes when a connected tool changes, and small changes as your reporting needs grow and change.
Tell us what your team does by hand today, or book a strategy call with our team.


 A specialist replies personally 4.9 from 566 client reviews