Conversion rate optimization services built on research and honest tests
Our conversion rate optimization services help businesses get more leads and sales from the traffic they already have, by finding where visitors drop out, fixing the causes and proving each change with a controlled test. They suit ecommerce stores, SaaS products, lead generation sites and advertisers whose landing pages are not keeping up with their ad spend, with A/B tests where traffic allows and research-led fixes where it does not.
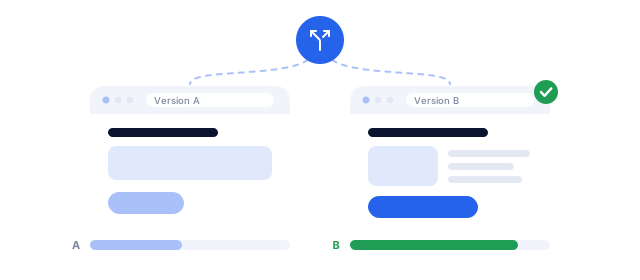
Conversion rate optimization (CRO) is the process of increasing the share of visitors who take a valuable action, such as buying, booking or signing up. Conversion rate optimization services combine analytics, user research and controlled A/B tests to find what stops people converting, fix it and prove the result, so growth comes without buying more traffic.
Research comes before testing: analytics shows where people drop out, recordings and surveys show why.
A test needs enough traffic to reach a reliable answer; lower-traffic sites gain through research-led fixes measured before and after.
Checkout, forms and landing page message match are where most leaks hide.
Judge every test on revenue or qualified leads, never on clicks alone.
Best for
Online stores, SaaS sign-ups, lead forms and paid landing pages: A/B tests on busier pages, a research-led program on quieter ones
What you get
Conversion audit, research findings, a prioritized test backlog, built and QA'd tests, analysis and monthly reports
Typical timeline
Research and audit in 2 to 4 weeks. First test live in weeks 3 to 6. Most tests run 2 to 6 weeks, depending on traffic.
Pricing
Driven by traffic, test volume and design and development work. Published pricing we reviewed ranged from about $1,000 to $12,500 a month for ongoing programs. Our programs run from under $750 to $10,000+ a month, and we quote after a free audit.
What our conversion rate optimization services include
Six workstreams that turn research into tested, shipped improvements. Measurement is checked first, because every later decision depends on it.
We start in GA4 and your store or CRM data: where visitors enter, which steps lose them, and how results differ by device, channel and new or returning visitors. We confirm conversions are tracked correctly first, because a duplicated purchase event or broken form tag makes every later conclusion wrong. The output is a funnel map with the biggest leaks ranked by revenue at stake.
Heatmaps, session recordings and surveys
Numbers show where people leave; behavior and feedback show why. We review heatmaps and recordings in tools such as Microsoft Clarity, which is free with no traffic limits, or Hotjar, and run short on-site and post-purchase surveys. Form fields and personal data are masked. When the whole journey needs expert review, our UX audit team goes deeper.
Hypothesis backlog and prioritization
Every finding becomes a written hypothesis: what we will change, for whom, why we expect it to work and which metric decides. We score the backlog on expected impact, strength of evidence and effort, so the first tests target pages with enough traffic and money at stake. You see the whole backlog, not just the ideas that reached a test.
A/B testing with statistical rigor
We calculate sample size and minimum detectable effect before launch, run tests in full weeks to cover weekday and weekend behavior, and never stop early because a result looks good. We check for sample ratio mismatch and watch guardrail metrics such as revenue per visitor. Google Optimize closed in September 2023, so tests run in tools such as VWO, Optimizely or Convert.
Landing page and checkout optimization
Checkout is where intent turns into revenue, and where friction costs the most. Baymard Institute estimates that large ecommerce sites can gain a 35.26% increase in conversion rate through better checkout design. We work on forms, guest checkout, early delivery costs, payment options and trust signals, and our landing page development team builds new pages when tests call for them.
Implementation and learning reports
Winning variations are built into your site as clean code by our developers, rather than left running in the testing tool indefinitely. Each month you get a report of tests run, results with confidence levels, estimated revenue impact and what losing tests taught us. Losing and flat tests often reveal as much about your customers as winners do.
What a structured CRO program changes
Website conversion optimization pays off in places your finance team and your ad accounts will both notice. These are the changes we work toward.
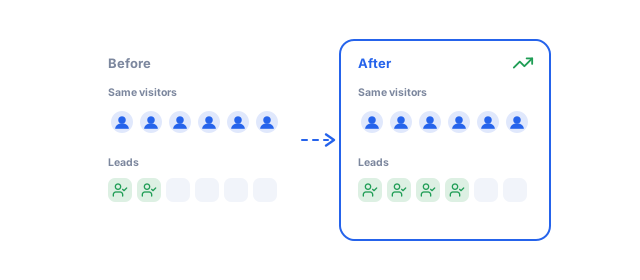
Every lift in conversion rate lowers your cost per acquisition. A landing page converting at 3% instead of 2% turns the same 10,000 visitors into 300 leads instead of 200, a 50% increase without buying more clicks. That makes CRO one of the most direct ways to improve the return on a PPC management budget.
Fewer abandoned checkouts
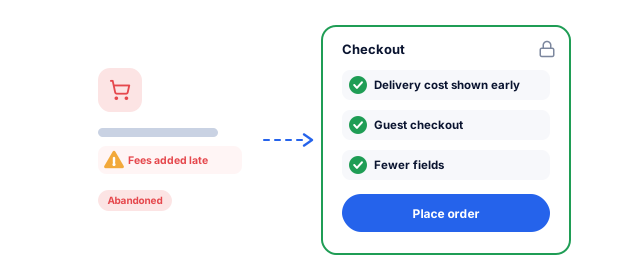
Baymard's research puts the average documented cart abandonment rate at 70.22%. Leaving aside shoppers who were just browsing, the most common reason US shoppers give is extra costs that were too high, cited by 40%. Showing delivery costs early, offering guest checkout and cutting form fields address the reasons people actually give, instead of guessing at them.
Decisions based on evidence, not opinion
Redesigns often start from what the team, or the most senior person in the room, prefers. A test settles the question with your visitors' behavior. Over months, the backlog and results become a record of what your customers respond to, which is useful well beyond the website: in ads, emails and sales conversations.
Faster, steadier pages
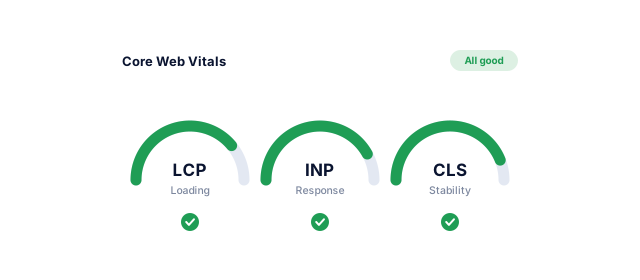
Slow, jumpy pages lose people before they read a word. We check Core Web Vitals against Google's thresholds: Largest Contentful Paint within 2.5 seconds, Interaction to Next Paint of 200 milliseconds or less and Cumulative Layout Shift of 0.1 or less, at the 75th percentile of visits. Speed fixes improve every visit and support technical SEO too.
Lower risk on big changes
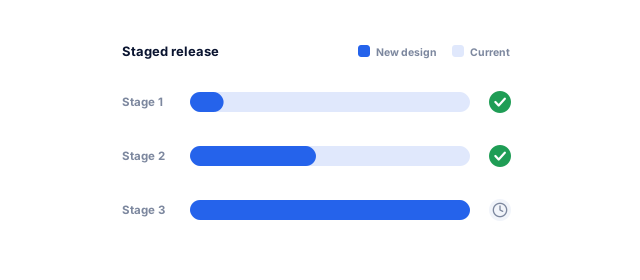
Launching a new design, pricing page or checkout to every visitor at once is a bet. Testing it against the current version first shows whether it really performs better, and catches the redesign that quietly loses revenue. When a change cannot be tested, we release it in stages and compare before and after, allowing for seasonality.
Qualified leads, not just more form fills
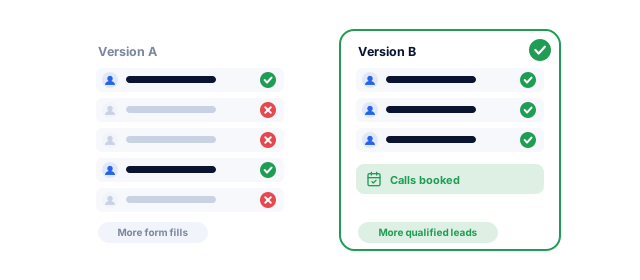
For lead generation, a shorter form can raise submissions while lowering lead quality. We connect tests to your CRM, so a variation wins only if it brings more qualified leads or booked calls, not just more submissions. That keeps CRO aligned with what your sales team actually needs, and stops a test from winning on volume alone.
Getting traffic but not enough sales or leads?
Pick the problem closest to yours. We look at your analytics, key pages and checkout or forms to find where visitors drop off and why, and send the first tests we would run.
Your free fix planFor your main problem
1What is causing itYour analytics, key pages and checkout or forms
2What we would change firstRanked by the effect on your conversion rate
3What it should do to your numbersA realistic range, not a promise
We confirm that GA4, your tag manager and your store or CRM record conversions correctly and agree closely enough to trust. We fix missing events, duplicate purchases and broken form tracking, and agree the primary metric for each funnel.
Tracking audit
Conversion definitions
Fixed events
Numbers you can trust
Research
We analyze funnels by device and channel, review heatmaps and recordings, run surveys, and audit key pages against usability principles and checkout research. Each finding is backed by evidence from at least one source, ideally two.
Funnel analysis
Research findings report
Page-level audit notes
You see where and why people leave
Hypotheses and roadmap
Findings become hypotheses scored for impact, evidence and effort, then ordered into a testing roadmap. We check each test's required sample size against your traffic before committing to it, so no test is planned that cannot finish. You approve the roadmap.
Prioritized hypothesis backlog
Sample size estimates
Test roadmap
The right tests first
Design and build
Our designers and developers build each variation, then QA it across browsers and devices, confirm tracking fires and check the variant does not slow the page. Nothing launches without a sample size and stopping rule agreed in advance.
Variation designs
QA checklist
Test plan with stopping rule
Tests that are fair from day one
Run and analyze
Tests run in full weeks until they reach the planned sample, however good an early result looks. We analyze the primary metric, guardrails and key segments such as device and channel, report confidence honestly, and treat inconclusive results as information rather than failure.
Test results report
Segment analysis
Learning log
Clear decisions, including no
Roll out and repeat
Winners are built into your site properly and monitored after launch, to confirm the gain holds outside the test. Each month we review results with you, update the backlog with what we learned and choose the next tests together.
Rollout of winners
Monthly report and call
Updated backlog
Gains that build on each other
What a lift in conversion rate is worth
Put in your own traffic, conversion rate and order or lead value to see what a lift would add each month and each year, before you spend anything on testing.
CRO for your business model
What counts as a conversion, and where people get stuck, depends on how you sell. The research and testing plan follows your model.
01 / 05
Ecommerce and Shopify stores
Ecommerce CRO works through product pages, collection filters, cart and checkout, judged on revenue per visitor rather than conversion rate alone, so a test cannot win by pushing cheaper orders. Shopify reserves advanced checkout customization for its Plus plan, so on other plans we test what the platform allows and fix the rest on product and cart pages. Our Shopify website team builds the winners.
For SaaS, a sign-up is only the start. We test pricing pages, plan comparisons, sign-up forms and the first steps inside the product, and measure trial-to-paid conversion and activation, not sign-ups alone. A pricing page that brings more trials but fewer paying customers loses. Product changes are shipped by our SaaS application development team when they go beyond the marketing site.
Lead forms, quote requests, call buttons and booking widgets are tested against the leads your sales team accepts. We try multi-step forms, clearer next steps, proof near the form and fewer required fields, and pass outcomes back from HubSpot or Salesforce, so a variation only wins if it brings better leads. Our lead generation automation team routes those leads quickly.
Paid visitors arrive with a specific promise in mind, so the page must repeat it. We build landing pages per campaign or ad group with matching headlines and offers, remove navigation that leaks attention, and test forms and proof. Better pages can also improve landing page experience, one of the Quality Score components Google reports. We work alongside our Google Ads management team on shared targets.
Patients choosing a clinic need reassurance before they book: doctors' credentials, clear fees, location and the next available slot. We test appointment flows, call buttons and booking forms on mobile first, and keep health details out of analytics, recordings and surveys. Conversion is measured as booked or attended appointments, not form views. See our work for healthcare businesses and the Nabhaya Clinic booking software.
Before any test, we check whether your traffic can answer the question. This table shows roughly how many visitors each version of a page needs. If the numbers are out of reach, we test bolder changes, test higher in the funnel, or make research-led improvements instead.
Visitors needed per version for a two-sided test at 95% confidence and 80% power, calculated with the standard two-proportion formula, so an A/B test needs twice this number in total. Lifts are relative: a 20% lift on a 3% conversion rate means reaching 3.6%. Divide the total by weekly visitors to the tested page to estimate how many weeks a test will run.
Your first 90 days of conversion rate optimization
Measurement and research come before any test, so the first month builds the evidence and the next two put it to work, through A/B tests or, on lower-traffic sites, research-led fixes measured before and after.
Tracking audit with missing and duplicate events fixed
Funnel analysis by device and channel
Research findings from heatmaps, recordings and surveys
Prioritized hypothesis backlog with sample size estimates
By day 30, you have numbers you can trust, a written account of where and why visitors leave, and a test roadmap to approve.
2Days 31 to 60
First tests live
Approved test roadmap
Quick fixes from research shipped, such as broken forms
First variations designed, built and checked across devices
First test live by week 6, with a written stopping rule
By day 60, your first test is running on a page with enough traffic to reach its planned sample.
3Days 61 to 90
First results and rollout
Test analysis once the planned sample is reached
Winners built into your site as clean code
Learning log and an updated backlog
Monthly report and call to choose the next tests
By day 90, you usually have a first tested answer, a record of what it taught you and the next tests queued.
What you see every month
Each month you get a written report and a review call. It leads with the numbers that matter to your business, says what we changed and why, and sets out what we test next.
Every report includes
Each test: what we changed, the result and how sure we are
Conversion rate and revenue per visitor, by device
Online stores that want more revenue per visitor from the traffic they have
SaaS products that want more trials turning into paying customers
Lead generation sites that want more qualified leads, not just more form fills
Advertisers whose landing pages are not keeping up with their ad spend
We can also help when
Your traffic is lower: we run a research-led program, where analytics, recordings, surveys and a UX audit find the problems, and we ship fixes and compare results before and after
You need gains within 30 days: we ship the obvious fixes research finds, such as broken forms or hidden delivery costs, straight away, while the first tests build
You are planning a redesign: we test key pages of the new design against the current site, or release it in stages, so it does not quietly lose revenue
You want a guaranteed conversion increase: we commit to the method, with tracking you can trust, sample sizes set in advance and a plain report every month
Many CRO programs stall between the person with the idea and the developer who has to build it. Our analysts, designers and developers work in-house together, so tests ship faster and winners go into your site as proper code. When a page needs a full redesign, our website UI/UX design team takes it on.
02
Honest testing at any traffic level
For lower-traffic sites, we run a research-led program: analytics, recordings and surveys find the problems, and we ship fixes and measure them before and after instead of waiting on tests that cannot finish. We report inconclusive and losing tests as plainly as winners, and commit to the method rather than a fixed uplift. A rolling monthly agreement with 30 days' notice means you stay because the program keeps paying for itself.
03
Connected to your ads and search
We are a Google Premier Partner, Meta Business Partner and Microsoft Advertising Partner, so landing page tests are planned with the campaigns that feed them, and wins flow straight into ad spend decisions. Clients stay with us 1.6 years on average and rate us 4.9 on Clutch from 221 reviews. Your analytics and testing accounts remain yours.
Certified partners on the platforms we manage for you
Results we can put numbers on
Results from our paid media, SEO and website work, with the full story behind each number. Conversion gains are reported the same way: against revenue and qualified leads.
"improveFX transformed our PPC campaigns with smarter targeting, compelling ad creatives, and continuous optimization."
185%conversion growth
42%lower cost per lead
210%more qualified leads
Nadya SmolskayaCo-founder, CleverBoss
"From designing a high-converting website to managing our SEO, Google Ads, and Google Business Profile, improveFX delivered exceptional results across every channel."
210%more qualified leads
185%organic and local traffic growth
92%keywords on page one
Maureen CappalloBroker and founder, Momentus Real Estate Group
"We now rank for highly competitive keywords while our PPC campaigns deliver qualified leads at a lower cost."
80%keywords on page one
620%return on investment
52%lower cost per lead
Divyanshi HirparaFounder, Trunkboxbaby
"Our marketing reach expanded by 50% after implementing their innovative SEO and content writing services. They truly understand the e-commerce landscape."
43.6%more sales
621%return on investment
63%keywords on page one
Allen RayFounder, Ecom Fashion
Services that strengthen your CRO
Conversion improves fastest when traffic, pages and user experience are planned together.
How much do conversion rate optimization services cost?
Ongoing programs usually cost a monthly fee. Published pricing we reviewed ranged from about $1,000 to $12,500 a month, with one-off page audits or rebuilds priced separately.
The fee depends on how many tests run each month, how much design and development each needs, the research involved and your testing tool's cost. Lower-traffic sites and smaller budgets start with a research-led program or a one-off audit on a fixed fee, rather than a testing retainer. We quote after a free audit, with tools and fees shown separately.
What do conversion rate optimization services include?
A measurement check, research (analytics, heatmaps, recordings and surveys), a prioritized hypothesis backlog, designed and built A/B tests, analysis, rollout of winners and monthly reporting.
A CRO agency should also tell you which ideas were not tested and why, and share losing results. With us, landing page builds and development of winning variations are included in the program rather than handed back to your team.
How much traffic do we need for CRO?
Enough for a test to reach its sample size within a few weeks. At a 3% conversion rate, detecting a 20% lift takes about 13,900 visitors per version, or about 27,800 in total.
With less traffic, we run a research-led program instead: fixes based on analytics, recordings and surveys, bolder tests that can show larger effects, tests on busier pages higher in the funnel, and careful before-and-after comparisons. We check which suits you in the free audit, before you commit.
How long does it take to see results from CRO?
Research findings arrive in 2 to 4 weeks and the first test usually goes live in weeks 3 to 6. Each test then runs for 2 to 6 weeks, depending on traffic.
Obvious fixes found in research, such as broken forms or hidden delivery costs, can be shipped straight away. A meaningful view of what the program adds usually takes a quarter, because results build test by test. Results depend on your traffic, offer and how much can be changed.
What is a good conversion rate?
A good conversion rate is a better one than your own last quarter, on the same traffic and the same definition. Industry averages vary too much by offer, price and traffic source to be a useful target.
A store selling low-cost repeat items and a firm selling $50,000 contracts will never share a benchmark. Compare your rate by device, channel and landing page instead. Big gaps between segments, such as mobile far below desktop, usually point to the first things worth fixing.
Is CRO worth it if we already run paid ads?
Usually yes. Paid traffic is the most expensive traffic you have, so raising its conversion rate lowers cost per acquisition directly, without raising bids.
Paid campaigns also make testing easier, because you control which page each visitor lands on. We start with the landing pages that take the most spend, check that each matches its ads, and test from there, sharing results with whoever manages the campaigns.
Will A/B testing hurt our SEO?
Not when tests follow Google's guidance: avoid cloaking, use rel="canonical" on variation URLs, use 302 rather than 301 redirects, and remove test code once a test finishes.
We follow Google's website testing guidance on every test, keep test scripts light so they do not slow pages, and build winners into the site properly instead of leaving them in the testing tool.
What is the difference between CRO and UX design?
UX design shapes how a site or product works for people. CRO measures and tests changes against a business goal, such as purchases or qualified leads.
They overlap heavily. UX research often finds the problems a CRO program then tests, and a CRO program shows which UX changes actually moved revenue. We run both, so findings move between them without handoffs between agencies.
Do you guarantee a conversion rate increase?
Not a fixed lift. Some tests lose, and results depend on your traffic, offer, prices and market, so no honest agency can promise a number.
What we commit to is the method: tracking you can trust, research behind every test, sample sizes calculated in advance, results reported plainly, and winners shipped properly. Over a program, that process is what produces gains you can rely on.
Which testing and analytics tools do you use?
We use GA4 and Google Tag Manager for measurement, Microsoft Clarity or Hotjar for behavior, and VWO, Optimizely or Convert for testing, depending on your traffic and budget.
If you already pay for a tool, we use it. Accounts are set up in your name, so the data, recordings and test history stay with you. For Shopify and other platforms, we check that the testing tool supports your setup before recommending it.
What is sample size, and why does it decide whether A/B testing makes sense?
Sample size is the number of visitors each version needs before a difference can be trusted rather than put down to chance. Small samples swing wildly: seven heads in ten coin flips is unremarkable, but 700 in a thousand would be extraordinary.
Three things set it: your current conversion rate, the smallest lift worth detecting and how sure you want to be. Lower rates and smaller lifts need far more visitors, as the traffic table on this page shows, and a busy page with few sales still struggles. If a test cannot reach its sample in about six weeks, we test a bolder change or a busier page instead.
What significance and test-length rules do you follow?
By default we plan tests at 95% confidence and 80% power, the same basis as the traffic table on this page, and fix the sample size and stopping rule before launch. Tests run in whole weeks, at least two, so weekday and weekend behavior are both included.
We do not stop a test early because it looks like a winner, since checking repeatedly and stopping at the first good result inflates false positives. We check for sample ratio mismatch and watch guardrail metrics. We do not promise a win rate: many well-run tests lose or end flat, and those results still show what not to build.
Which CRO metrics matter beyond conversion rate?
Revenue per visitor for stores, qualified leads or booked calls for lead generation, and trial-to-paid conversion or activation for SaaS. Conversion rate alone can rise while the business earns less.
Average order value shows whether a change pushed cheaper baskets. Step completion rates show where in a funnel a change helped or hurt. Form errors, page speed and refund or cancellation rates work as guardrails, so a test that wins on its main metric but harms one of them is reviewed before rollout. Click-through rate is useful inside a page, but it measures interest, not purchase.
Ready to get more from your marketing?
Tell us what is holding your marketing back, or book a strategy call with our team.
A look at what you spend and what it brings in
Fixes ranked by their effect on leads and cost
A call with a specialist to plan the next steps, no obligation
A specialist replies personally 4.9 from 566 client reviews